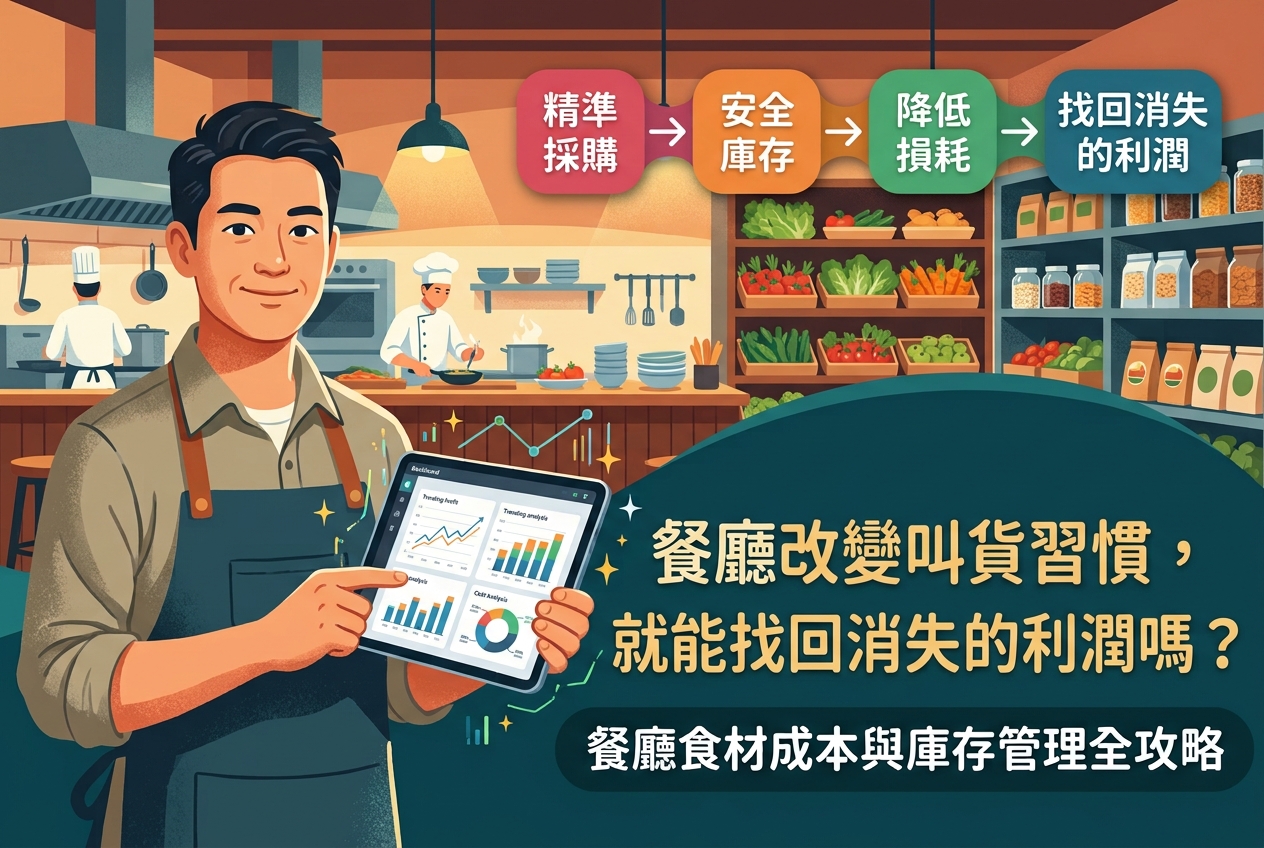
Many restaurant owners share the exact same frustration: "My tables are packed every night and the sales numbers on my POS look fantastic—so why is there barely any cash left in the bank at the end of the month?"
The answer is simple: High revenue does not automatically mean high profit.
If you aren’t keeping a close eye on food waste, fluctuating ingredient prices, third-party delivery commissions, and scheduling efficiency, your hard-earned revenue will quietly slip through the cracks. In this guide, we’ll break down your restaurant’s cost structure, walk through 5 must-know financial formulas, and show you how modern restaurant tech can turn top-line sales into real bottom-line profit.
1. The Two Types of Restaurant Expenses: Why "Variable Costs" Make or Break Your Profit
Before crunching the numbers, you need to divide your restaurant’s expenses into two main buckets:
- Fixed Costs: Expenses that stay the same no matter how busy you are—you pay them even if zero customers walk through the door. This includes rent, equipment depreciation, salaried management pay, insurance, internet, and software subscriptions.
- Variable Costs: Expenses that rise and fall with your sales volume. This includes raw ingredients, takeout packaging, food waste and spoilage, hourly wages, overtime pay, utilities, and delivery platform commissions.
💡 Operator Insight: Fixed costs are largely locked in the moment you sign your lease. That means if you want to squeeze more profit out of your business, the secret lies in mastering your variable costs—especially daily fluctuating food and purchasing expenses.
2. The 5 Essential Cost Formulas Every Restaurant Owner Must Know
To build a healthy financial foundation, make sure these 5 core formulas are part of your monthly review:
1. Food Cost Percentage (COGS)
Measures how much you spend on ingredients for every $100 in food sales.
Formula: (Total Food Cost ÷ Total Food Sales) × 100%
2. Labor Cost Percentage
Don't just count base wages—make sure to include payroll taxes, benefits, staff meals, overtime, and bonuses.
Formula: (Total Labor Cost ÷ Total Sales) × 100%
3. Gross Profit Margin
The money left over after subtracting direct costs (ingredients + packaging; and delivery commissions if you rely heavily on delivery) to pay for your rent, labor, and profit.
Formula: ((Total Sales - Direct Costs) ÷ Total Sales) × 100%
4. Total Monthly Operating Cost
Gives you a clear picture of your monthly burn rate and overall expense structure.
Formula: Food + Labor + Rent + Utilities + Packaging + Delivery Fees + Marketing + Misc. Overhead
5. Break-Even Point (Sales)
Tells you the exact minimum revenue you need to hit each month just to avoid losing money. Divide this number by the days you're open to get your daily sales target.
Formula: Total Fixed Costs ÷ Gross Profit Margin (%)
3. Industry Benchmarks: What Does a "Healthy" Cost Structure Look Like?
Once you have your numbers, how do you know if they’re actually healthy? While full-service restaurants, brunch spots, cafes, and bakeries all run a bit differently, the restaurant industry generally relies on these "Golden Benchmarks" as a health check:
- Food Cost: Keep it between 30% and 40% (or lower).
- Labor Cost: Keep it between 25% and 30% (or lower).
- Prime Cost (Food + Labor Combined): Together, these two must stay under 60% of your total sales. This is the ultimate lifeline for restaurant profitability.
- Rent: Ideally around 10% of total sales (once rent creeps past 12%–15%, it severely squeezes your operational flexibility).
4. Why Are Your Numbers Always Off? Busting 4 Common Restaurant Cost Myths
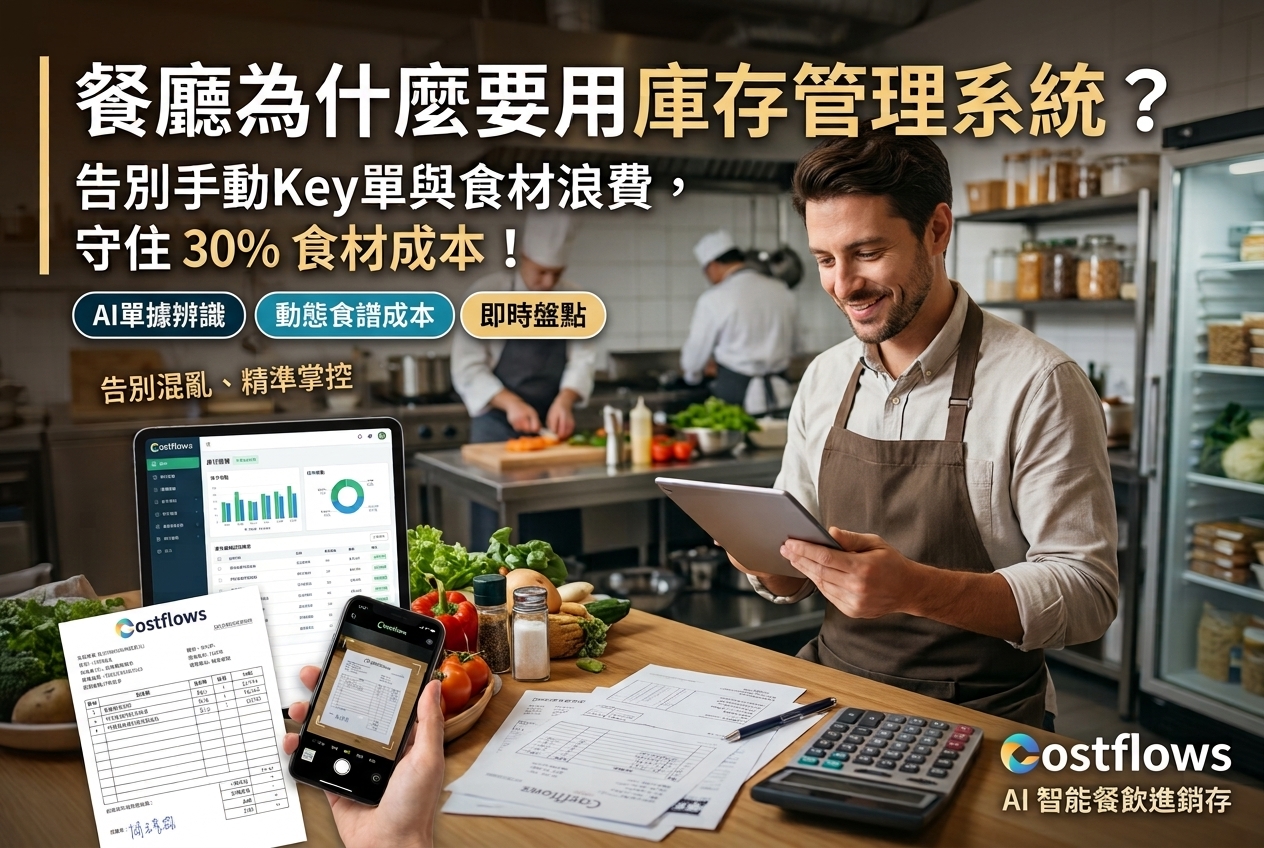
Even when owners use the right formulas, the cash in the bank at month-end often doesn't match the spreadsheet. That’s because relying on manual data entry and Excel creates massive blind spots. Here is how Costflows (an AI-powered restaurant cost, purchasing, and inventory platform) helps you fix them:
5. 4 Actionable Steps to Modernize Your Restaurant Cost Control
Once your restaurant scales to multiple menu items, multiple vendors, and both dine-in and delivery channels, tracking sales on a front-of-house POS isn't enough. You need to digitize your back-of-house spending too:
- Ditch Manual Data Entry (Digitize Invoices): When a delivery arrives (even with handwritten slips), just snap a photo and upload it to Costflows. AI recognition instantly turns messy paper into structured ingredient cost data.
- Optimize Ordering & Inventory (Stop Waste): Order based on system-recommended par levels and approval workflows. Run regular inventory counts to catch variances and put an end to over-prepping.
- Engineer Your Menu Dynamically (Protect Margins): Don't just look at your POS bestseller list. Cross-reference it with Costflows' real-time dish margins to decide which items to promote, reprice, or tweak with alternative ingredients.
- Connect Front- and Back-of-House Data (See the Whole Picture): Bridge the gap between your front-end POS sales data and back-end Costflows purchasing, inventory, and accounting data. No more waiting until the end of the month—check your real-time break-even status right from your phone.
Spend your time making strategic decisions and growing your profit—not drowning in data entry and invoice matching. Take a closer look at your cost structure today and let the right digital tools protect every dollar you work so hard to earn!
6. Frequently Asked Questions About Restaurant Costs (FAQ)


訂閱最新消息
不要錯過任何餐飲的資訊